Business Investment Efficiency: How Much Gross Profit Did the Cash Create?
Key takeaways
- Business Investment Efficiency is not a standard accounting metric. It is a working research lens for asking how much additional gross profit a company created from the cumulative cash spent to build the business.
- In this research note, the base year is 1993. The numerator is accumulated gross profit increase from the 1993 level, and the denominator is cumulative business investment cash.
- The lens focuses on gross profit increase, not operating profit, operating cash flow, free cash flow, valuation, or stock performance.
- One possible read from the Apple example is that the cash-to-gross-profit relationship appears to improve around the 2001 and 2005 candidate signal periods.
- The employee count chart is used only as timing context: Apple did not yet appear to be in full headcount acceleration mode when the BIE lens began to improve.
Everyone understands this question in investing:
If you put money into a stock, what did it become ten years later?
But companies often avoid the same question about themselves.
After all the money spent to build the business, how much more gross profit did the company actually create?
That is the simple question behind Business Investment Efficiency.
It is not a standard accounting metric.
It is not ROIC.
It is not ROIIC.
It is not a valuation method.
It is not investment advice.
It is a working lens for one practical question:
Since a base year, how much additional gross profit did the company create from the cumulative cash it spent to build the business?
In this research note, the base year is 1993.
The point is not to create a perfect academic formula.
The point is to recover a simple operating question that accounting often makes hard to see.
The simple version of Business Investment Efficiency
Business Investment Efficiency looks at two things.
The first is accumulated gross profit increase.
The second is cumulative business investment cash.
A simple version is:
Business Investment Efficiency = accumulated gross profit increase / cumulative business investment cash
In this note, accumulated gross profit increase means the increase in gross profit from the 1993 level.
For example, if Apple’s gross profit was 2,728 in 1993 and 4,042 in 2005, the numerator is:
4,042 − 2,728 = 1,314
That is the accumulated gross profit increase from the base year.
Gross profit is used as it appears in the income statement. Depreciation is not removed from gross profit in this lens. The goal is to keep the output simple and readable.
The denominator is cumulative business investment cash.
In this analysis, business investment cash is constructed as:
SG&A + cash used in investing activities − depreciation
This is a practical construction, not a standard accounting label.
SG&A captures much of the spending used to build the business system.
Cash used in investing activities captures capital investment and acquisition-related cash out.
Depreciation is deducted because it is not current cash spending. The goal is to avoid treating a non-cash accounting charge as new cash out.
Cost of goods sold is not included in the denominator.
That point matters.
If gross profit is the output, cost of goods sold has already been deducted. The direct cost of producing, buying, or delivering the product is already reflected before gross profit.
So the question is not:
How much revenue did total spending create?
The question is narrower:
After direct costs, how much additional gross profit did the business-building cash create?
That is the core of the lens.
Why this is different from normal accounting analysis
Normal accounting analysis often moves quickly below gross profit.
It asks whether operating profit improved.
It asks whether operating cash flow improved.
It asks whether free cash flow improved.
Those are useful questions.
But they are not the same question.
Business Investment Efficiency asks something earlier and simpler:
Did the cash spent to build the business create more gross profit?
Operating profit has already deducted SG&A.
Operating cash flow includes working capital, timing, taxes, and other cash effects.
Free cash flow deducts capital spending.
Those numbers answer other questions.
They can be useful later.
But they are not the core output of this lens.
The output here is gross profit increase.
The input is cumulative business investment cash.
That is why this lens is intentionally simpler than many financial metrics.
It is trying to see something that can disappear when accounting categories become too complex.
The question most companies should ask more directly
The question is almost too simple.
We spent this money.
What did it create?
Not in market value.
Not in a peer benchmark.
Not after every accounting layer has been applied.
What did it create in the company’s own gross profit engine?
If a company spends heavily for years, the answer should eventually appear somewhere.
If the business engine is improving, gross profit should start rising relative to the cumulative cash spent to build the business.
If that does not happen, the company may be spending without building enough income power.
That is why this lens can be useful for founders and finance leads.
It does not start with a sophisticated ratio.
It starts with common sense.
If the company keeps putting money into the business, the gross profit engine should eventually respond.
Apple as a small example
Apple is useful as an example because the later story is obvious.
But this note is not about Apple’s stock.
It is not a valuation call.
It is not a claim about Apple’s future.
It is only a small example of how Business Investment Efficiency can change the read.
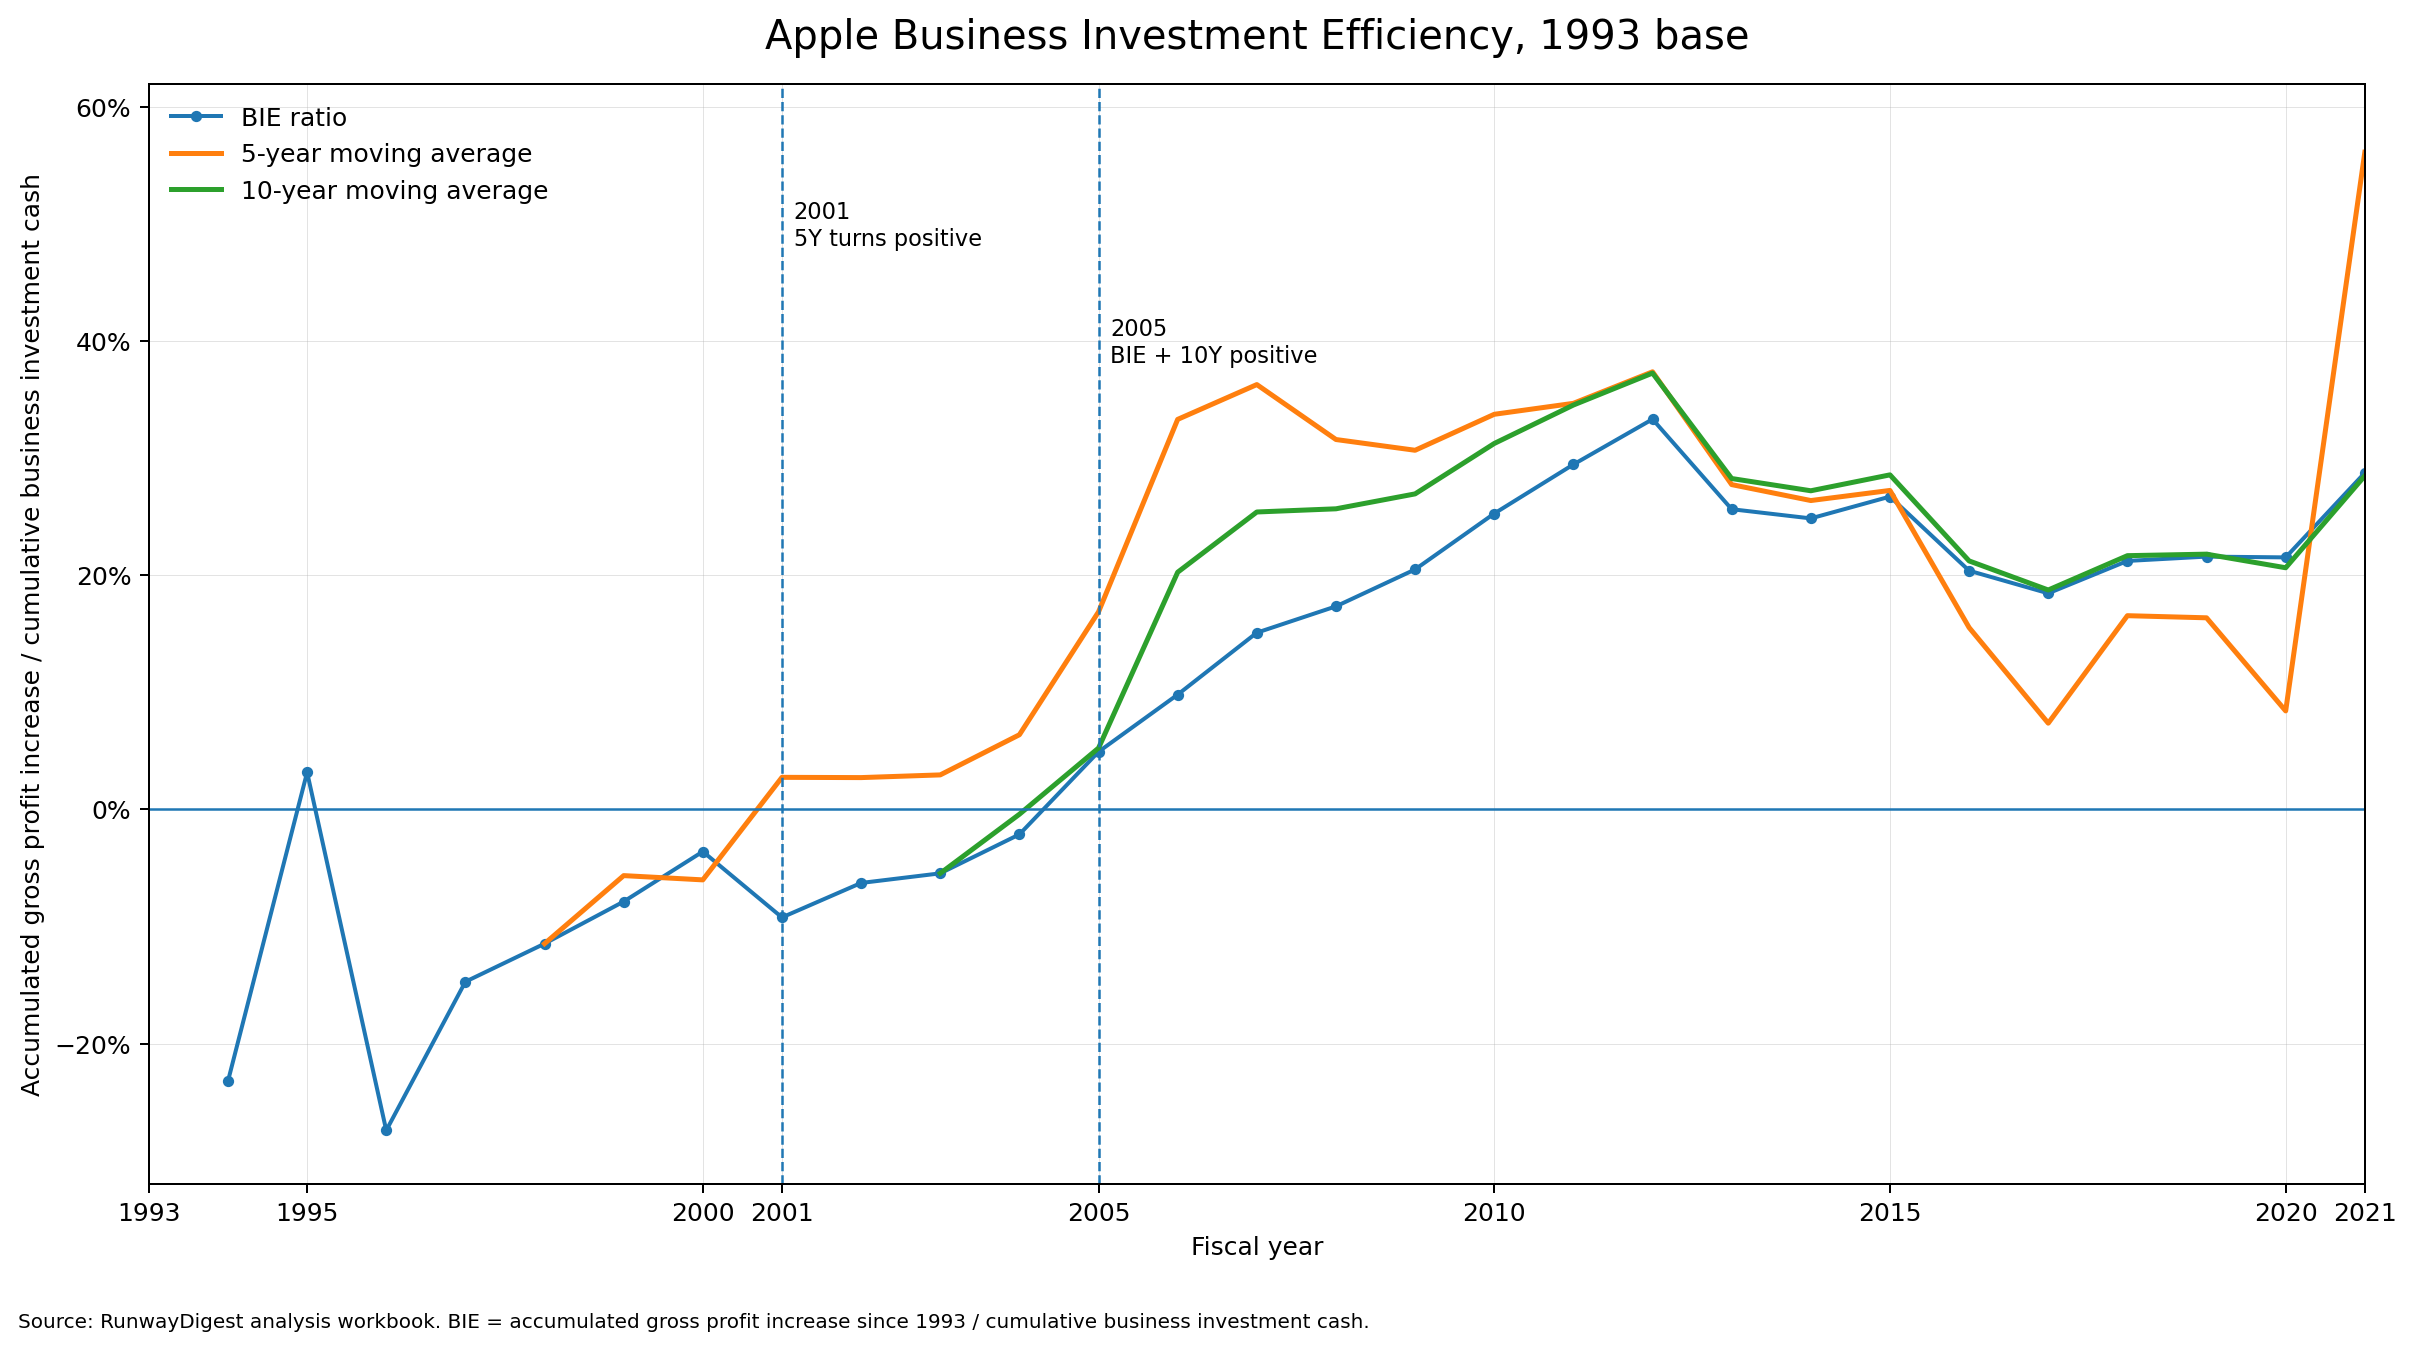
One possible read from the Apple data is that the Business Investment Efficiency lens began to improve before the company looked fully obvious from the outside.
Using 1993 as the base year, the lens compares gross profit increase from 1993 with cumulative business investment cash after 1993.
Around 2001, the 5-year moving-average view appears to move into positive territory.
Around 2005, both the current view and the 10-year moving-average view appear to be positive.
That does not prove that Apple’s growth “started” in those years.
It does not prove that one metric explains Apple.
A more careful read is this:
Those years may show a candidate Go signal: a point where cumulative business investment cash was beginning to look connected to accumulated gross profit increase.
That is the useful point.
Not that Apple was already visibly unstoppable.
Not that one chart explains the company.
But that the cash-to-gross-profit relationship may have begun to change before the company’s later strength became obvious.
Why the employee count matters
The second chart is not another efficiency metric.
It is timing context.
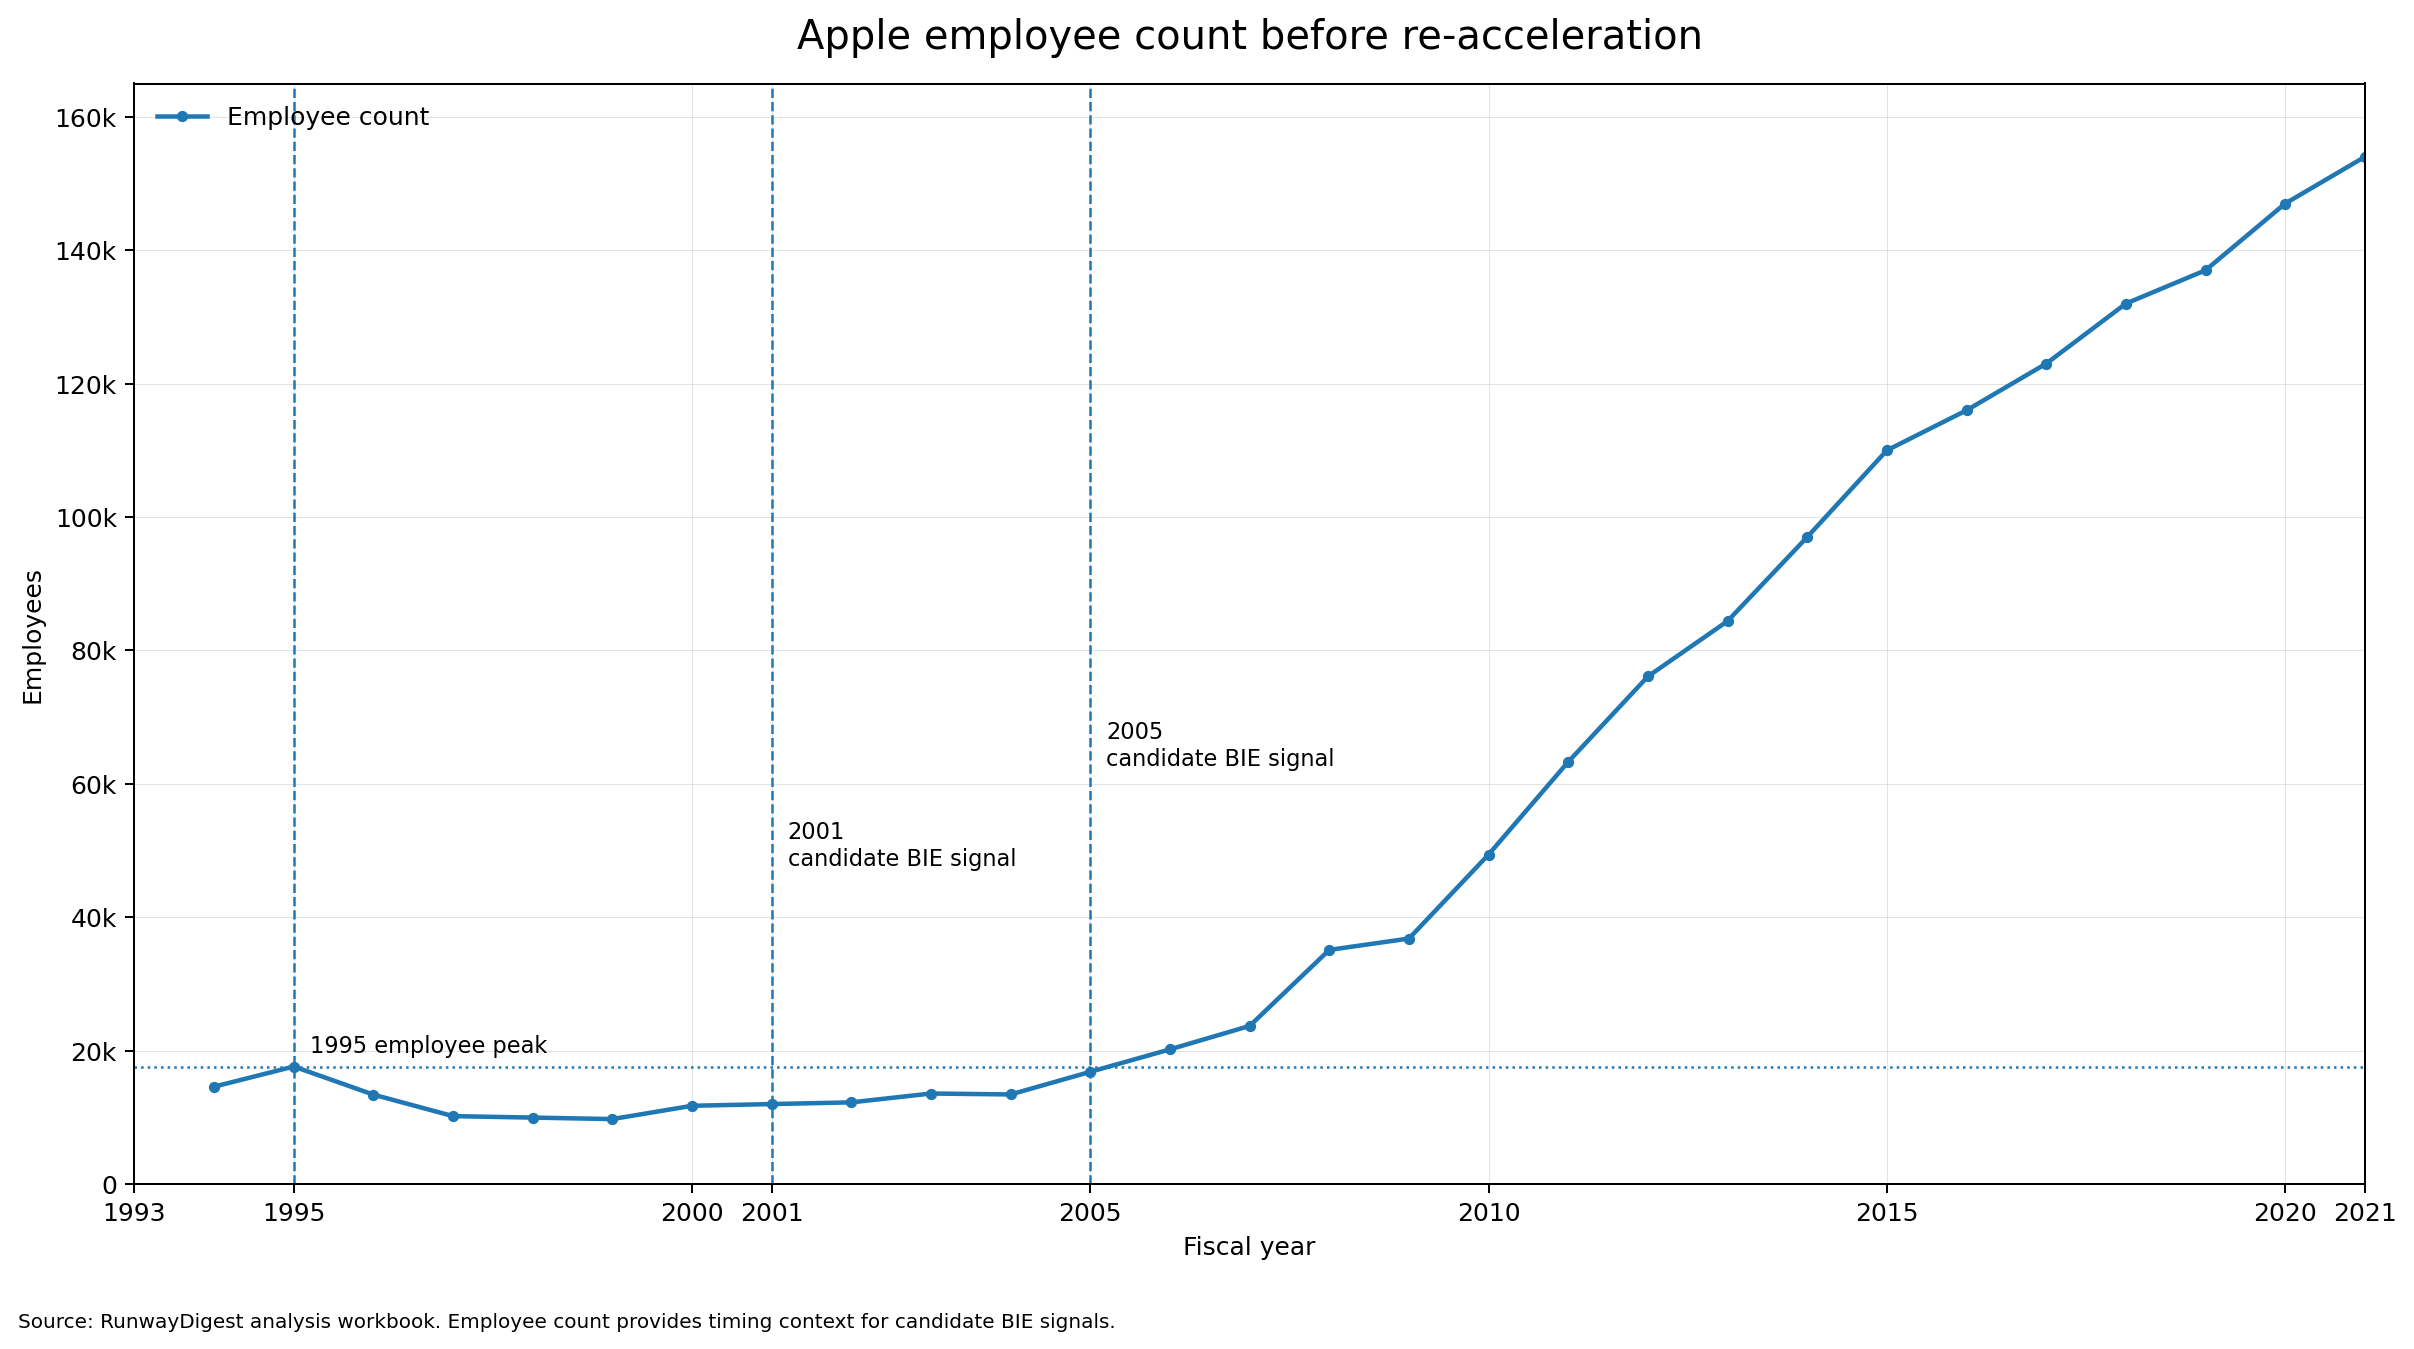
The important point is that Apple did not yet appear to be in full acceleration mode from a headcount perspective.
Employee count was still below the earlier 1995 peak.
In other words, the company had not yet obviously stepped on the gas by expanding the organization again.
That makes the BIE signal more interesting.
If employee count was still restrained, but the BIE lens was starting to turn positive, then the possible read is not simply:
The company hired a lot more people, so gross profit rose.
The possible read is sharper:
Before Apple visibly scaled the organization again, the cash already spent to build the business may have started to show a better gross-profit response.
That is why the employee chart matters.
It gives context for the Go signal.
The company did not yet look fully accelerated.
But the BIE lens may have been starting to say:
The business engine is becoming worth pressing harder.
Why many people miss this view
The strange part is that the question is simple.
How much gross profit did the money create?
But most company analysis does not stay with that question.
It moves into accounting categories.
It moves into peer benchmarks.
It moves into investor metrics.
It moves into margins, cash flow, valuation, and return on invested capital.
Those are all useful.
But they can make the basic question harder to see.
If a founder spends $1 million building the company, the practical question is not only whether this year’s operating profit improved.
The practical question is:
Did that spending help build a larger gross profit engine?
If a company spends years on product, sales, marketing, systems, acquisitions, and capacity, the question is not only whether the company is above or below a benchmark.
The question is:
After all that spending, is the company producing more gross profit than before?
That is the operating reality.
Business Investment Efficiency makes that question visible.
What founders and finance leads can do with this lens
A founder can use this lens to ask whether burn is becoming business strength.
A CFO can use it to explain whether years of spending have created a better income engine.
A finance lead can use it before approving the next hiring plan, product investment, expansion plan, or acquisition discussion.
The questions are direct:
Has cumulative business investment cash produced a meaningful increase in gross profit?
Is the trend improving?
Is the company getting a better gross profit response from the money it spends?
Is the business ready to press harder?
Or is it still spending without enough proof that the gross profit engine is responding?
This is not about one perfect number.
It is about the direction of the relationship.
When the relationship improves, the business may be getting stronger.
When it does not, the company may be using cash without building enough income power.
Why this connects to cash safety
A company can have cash in the bank and still spend badly.
A company can raise capital and still fail to create a stronger gross profit engine.
A company can grow revenue and still not improve the return on the money spent to build the business.
That is why Business Investment Efficiency is not just an analysis idea.
It is a cash safety question.
If business investment cash is not turning into gross profit increase, the company may be buying time instead of building strength.
If the relationship is improving, the company may have a stronger reason to keep investing.
The point is not to stop spending.
The point is to know whether spending is working.
What this note is not
This note is not investment advice.
It is not a stock recommendation.
It is not valuation.
It is not a claim that one metric explains Apple.
It is not a claim that every company should look like Apple.
It is not a standard accounting framework.
Business Investment Efficiency is a working research lens.
It exists to make one simple question easier to see:
After the money spent to build the business, how much additional gross profit did the company create?
That question is useful because it cuts through noise.
It does not ignore accounting.
But it refuses to let accounting hide the operating reality.
The real lesson
A company’s growth may become visible late.
But the cash-to-gross-profit relationship may begin changing earlier.
That is why a founder should not only ask:
Are we growing?
A better question is:
Is the money we spent creating more gross profit?
For a CFO, that question changes the spending discussion.
For a finance lead, it changes what to watch before the next budget, hiring plan, acquisition discussion, or cash update.
For a founder, it changes the meaning of burn.
Burn is not automatically bad.
But burn must become something.
Business Investment Efficiency asks the simplest version of that question:
What did the money become?
A company does not need a complex framework to start asking this.
It needs a clean cash read, a clear base year, and the discipline to ask whether spending is turning into a stronger gross profit engine.
Want a clearer read on your own cash direction?
RunwayDigest turns your inputs into a simplified runway, burn, and cash direction report and sends it by email.
Start free